
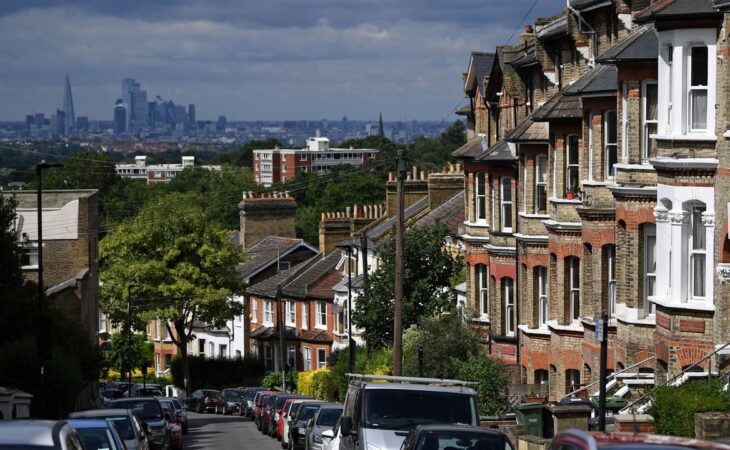
Figures are based on the most recent three months of approved mortgage transaction data
East Midlands: £244,426 (minus 0.3%)
Eastern England: £327,241 (minus 2.3%
London: £524,892 (minus 3.1%)
North East: £184,318 (2.0%)
North West: £249,916 (2.2%)
Northern Ireland: £228,708 (4.4%)
Scotland: £222,667 (2.8%)
South East: £379,258 (minus 2.4%)
South West: £298,057 (minus 2.4%)
Wales: £233,116 (1.6%)
West Midlands: £261,656 (0.3%)
Yorkshire and the Humber: £214,485 (minus 1.0%)

Leave Your Comment